<p>Community Data Trust Prototype: Technical Implementation</p>
- Year: 2024
Design Output
This project documents the design and implementation of a community data trust prototype: a practice-based response to the research enquiry into collective data governance. The prototype demonstrates how household energy data can be ingested, stored, and visualised in ways that support community-level decision-making.
Potential Data Types and Benefits
| Data Type | Example Use Case | Potential Community Benefit |
|---|---|---|
| Home/business energy use | Match demand with local generation | Increases local use, reduces export losses, supports decarbonisation |
| Home energy efficiency | Identify high-usage households | Targeted fuel poverty interventions, reduced costs, improved wellbeing |
| Building retrofit records | Shared documentation of insulation/heat pumps | Long-term housing planning, avoids siloed data |
| Community facility usage | Track heating/electricity demand in public sites | Efficient use, informs retrofit and scheduling |
| EV travel patterns | Analyse charging needs and routes | Supports charging infrastructure planning |
| Peatland restoration data | Monitor carbon sequestration and land condition | Evidence for funding and environmental schemes |
| Transport data | Aggregate travel patterns for service planning | Aligns services with resident needs |
Case Study: Home Energy Consumption
The prototype was developed around home energy consumption data in Hoy and Walls. Participants were given secure logins to access:
- Private Household Dashboard: Live readings of their own electricity use, collected via Efergy Engage monitoring devices.
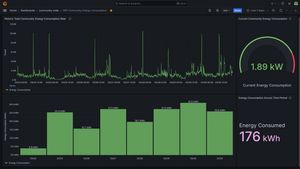
- Community Dashboard: Aggregated consumption data across all participants, providing a live picture of domestic energy use across the islands.
This dual view allowed individuals to make informed choices about their energy use, while also enabling collective insights at the community level.
Technical Implementation
The prototype was built using the TIG Stack:
- Telegraf: Data ingestion tool, configured to run a custom Python script every ten seconds.
- InfluxDB: Time-series database storing household energy readings.
- Grafana: Dashboard tool for visualising live and historical energy consumption.
Each component ran in its own Docker container, connected via a Docker network for seamless data flow. This containerised architecture ensured replicability, scalability, and ease of deployment.
Data Pipeline
-
Data Ingestion
- Efergy Engage devices collected live household energy data.
- A custom Python script queried the Efergy API and handled sensor variations and data gaps.
- Telegraf scheduled the script to run every ten seconds, pushing readings into InfluxDB.
-
Data Storage
- InfluxDB stored timestamped readings, enabling efficient queries and aggregation.
- Error logging and Git version control ensured resilience and transparency in development.
-
Data Visualisation
- Grafana dashboards translated raw watt readings into kilowatt hours (kWh).
- Eight dashboard modules were coded using Flux query language, providing both individual and community-level views.
- Users could download the underlying data for further analysis.
-
Hosting and Security
- The TIG Stack was deployed on an AWS EC2 server running Ubuntu.
- HTTPS encryption was enabled via Let’s Encrypt, ensuring secure data transfer.
- AWS Secrets Manager was used to protect API keys and login credentials.
- A custom domain (
island-data-futures.xyz) provided accessible entry for participants.
Prototype Build Stages
- Testing the TIG Stack locally: Learning Docker, containerising each component, and automating builds with Docker Compose.
- Data ingestion setup: Installing Efergy devices, configuring Python scripts, and error logging.
- Deployment to AWS: Uploading via GitHub, configuring EC2 server, and securing domain access.
- Dashboard creation: Coding Grafana modules to visualise both live and historical energy consumption.
Demonstration
Screenshots from the prototype included:
- Login page with secure authentication.
- Private household dashboard showing six-hour consumption history.
- Community dashboard showing aggregated seven-day energy use.
- Close-up graphs translating complex data into clear, actionable insights.
Technical Achievement
This prototype demonstrates that community-controlled data infrastructures are technically feasible using open-source tools and cloud hosting. By combining Dockerised services, custom Python scripts, and secure deployment practices, the project delivered a working model of how household energy data could be governed collectively.
The achievement lies not only in building a functioning pipeline, but in showing how technical design choices — containerisation, open standards, and security-first hosting — can support community ownership of digital tools.